Garfana
Your ultimate visualization and monitoring solution.
Analytics & DataUnverified:
About Garfana
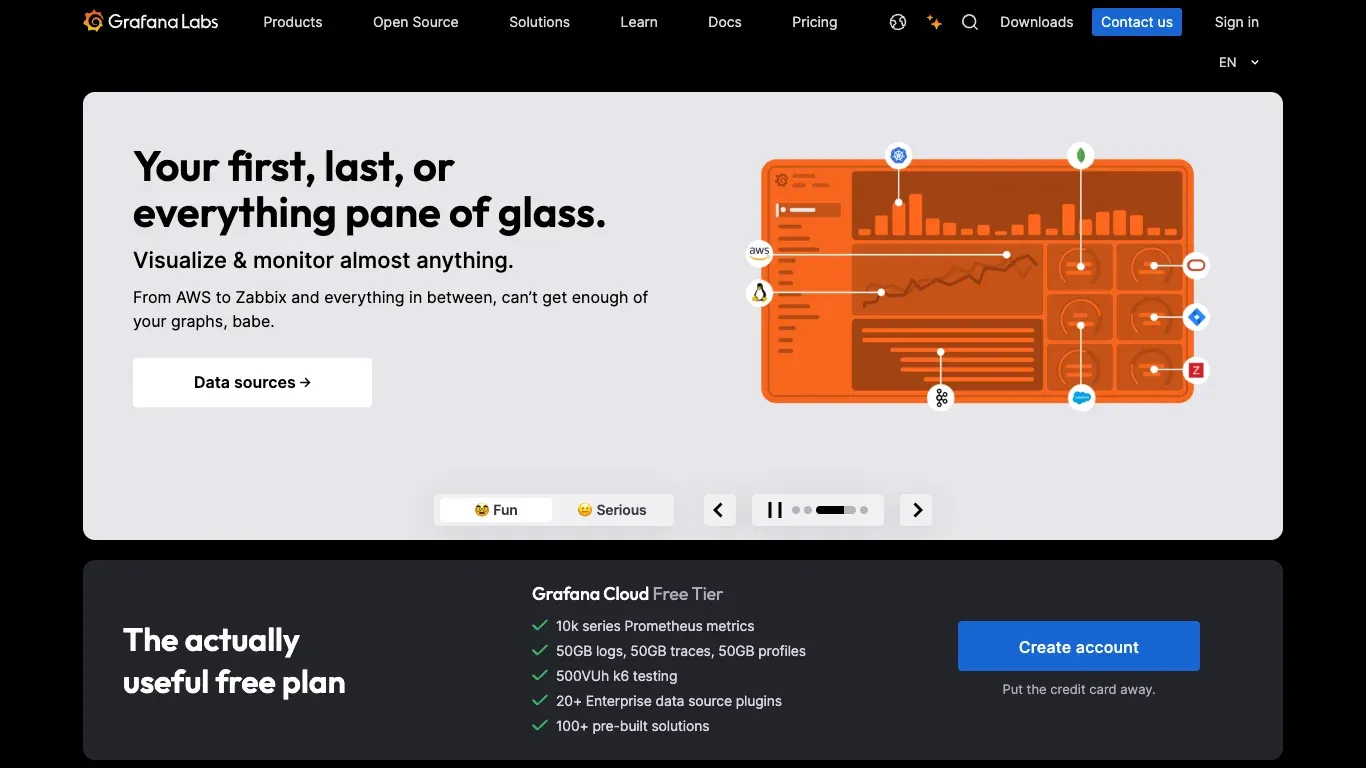
Grafana is a powerful open-source platform that allows you to visualize and monitor data from a variety of sources. It's designed for businesses and IT professionals aiming to gain insights and keep track of their systems and applications.
Key Features of Garfana
Grafana supports a vast range of data sources, providing real-time visualization and monitoring of metrics from AWS, Zabbix, and more. Its flexible panel-based visualization allows for creating dynamic dashboards that cater to specific needs.
The free tier offers significant capabilities, including 10k Prometheus metrics, 50GB logs, and extensive plugin support, making it accessible and adaptable for various users.
Use Cases of Garfana
Ideal for IT teams needing a centralized monitoring solution across their infrastructure. Grafana's dashboards allow for real-time insights into system performance, helping with proactive incident management.
Businesses can leverage Grafana to integrate and visualize data from different sources, facilitating data-driven decision-making and improving overall system observability.